This article explains how to use Run History to identify why a workflow step failed, interpret execution statuses, and resolve errors so the workflow runs correctly.
Prerequisites
- You must have an active workflow in HappyFox Workflows.
- The workflow must have run at least once for a Run History entry to exist.
Understanding Run History statuses
Every workflow execution appears as a single entry in Run History. Each entry shows how far the workflow progressed and where it stopped. Before you start debugging, identify which status the execution is showing
- Queued — The workflow is waiting to be picked up for processing.
- In Progress — The workflow is currently executing the actions in the workflow
- Completed — The workflow ran to completion and all actions executed without errors.
- Failed — The workflow stopped because one or more actions encountered an error. The entry shows the step number and error message.
- Waiting — The workflow is paused at an Approval action, waiting for an approver to respond. This is not an error state; it resolves once the approver accepts or declines.
Note: If you are expecting a workflow to have run but see no entry in Run History at all, the trigger event did not fire. Check the trigger source — for example, verify that the smart rule or webhook is active and that the ticket matched the trigger conditions.
Accessing and filtering Run History
- Log in to HappyFox Workflows.
- Navigate to Run History from the left navigation panel.
The Run History list view showing workflow executions with status, date, and trigger source columns.
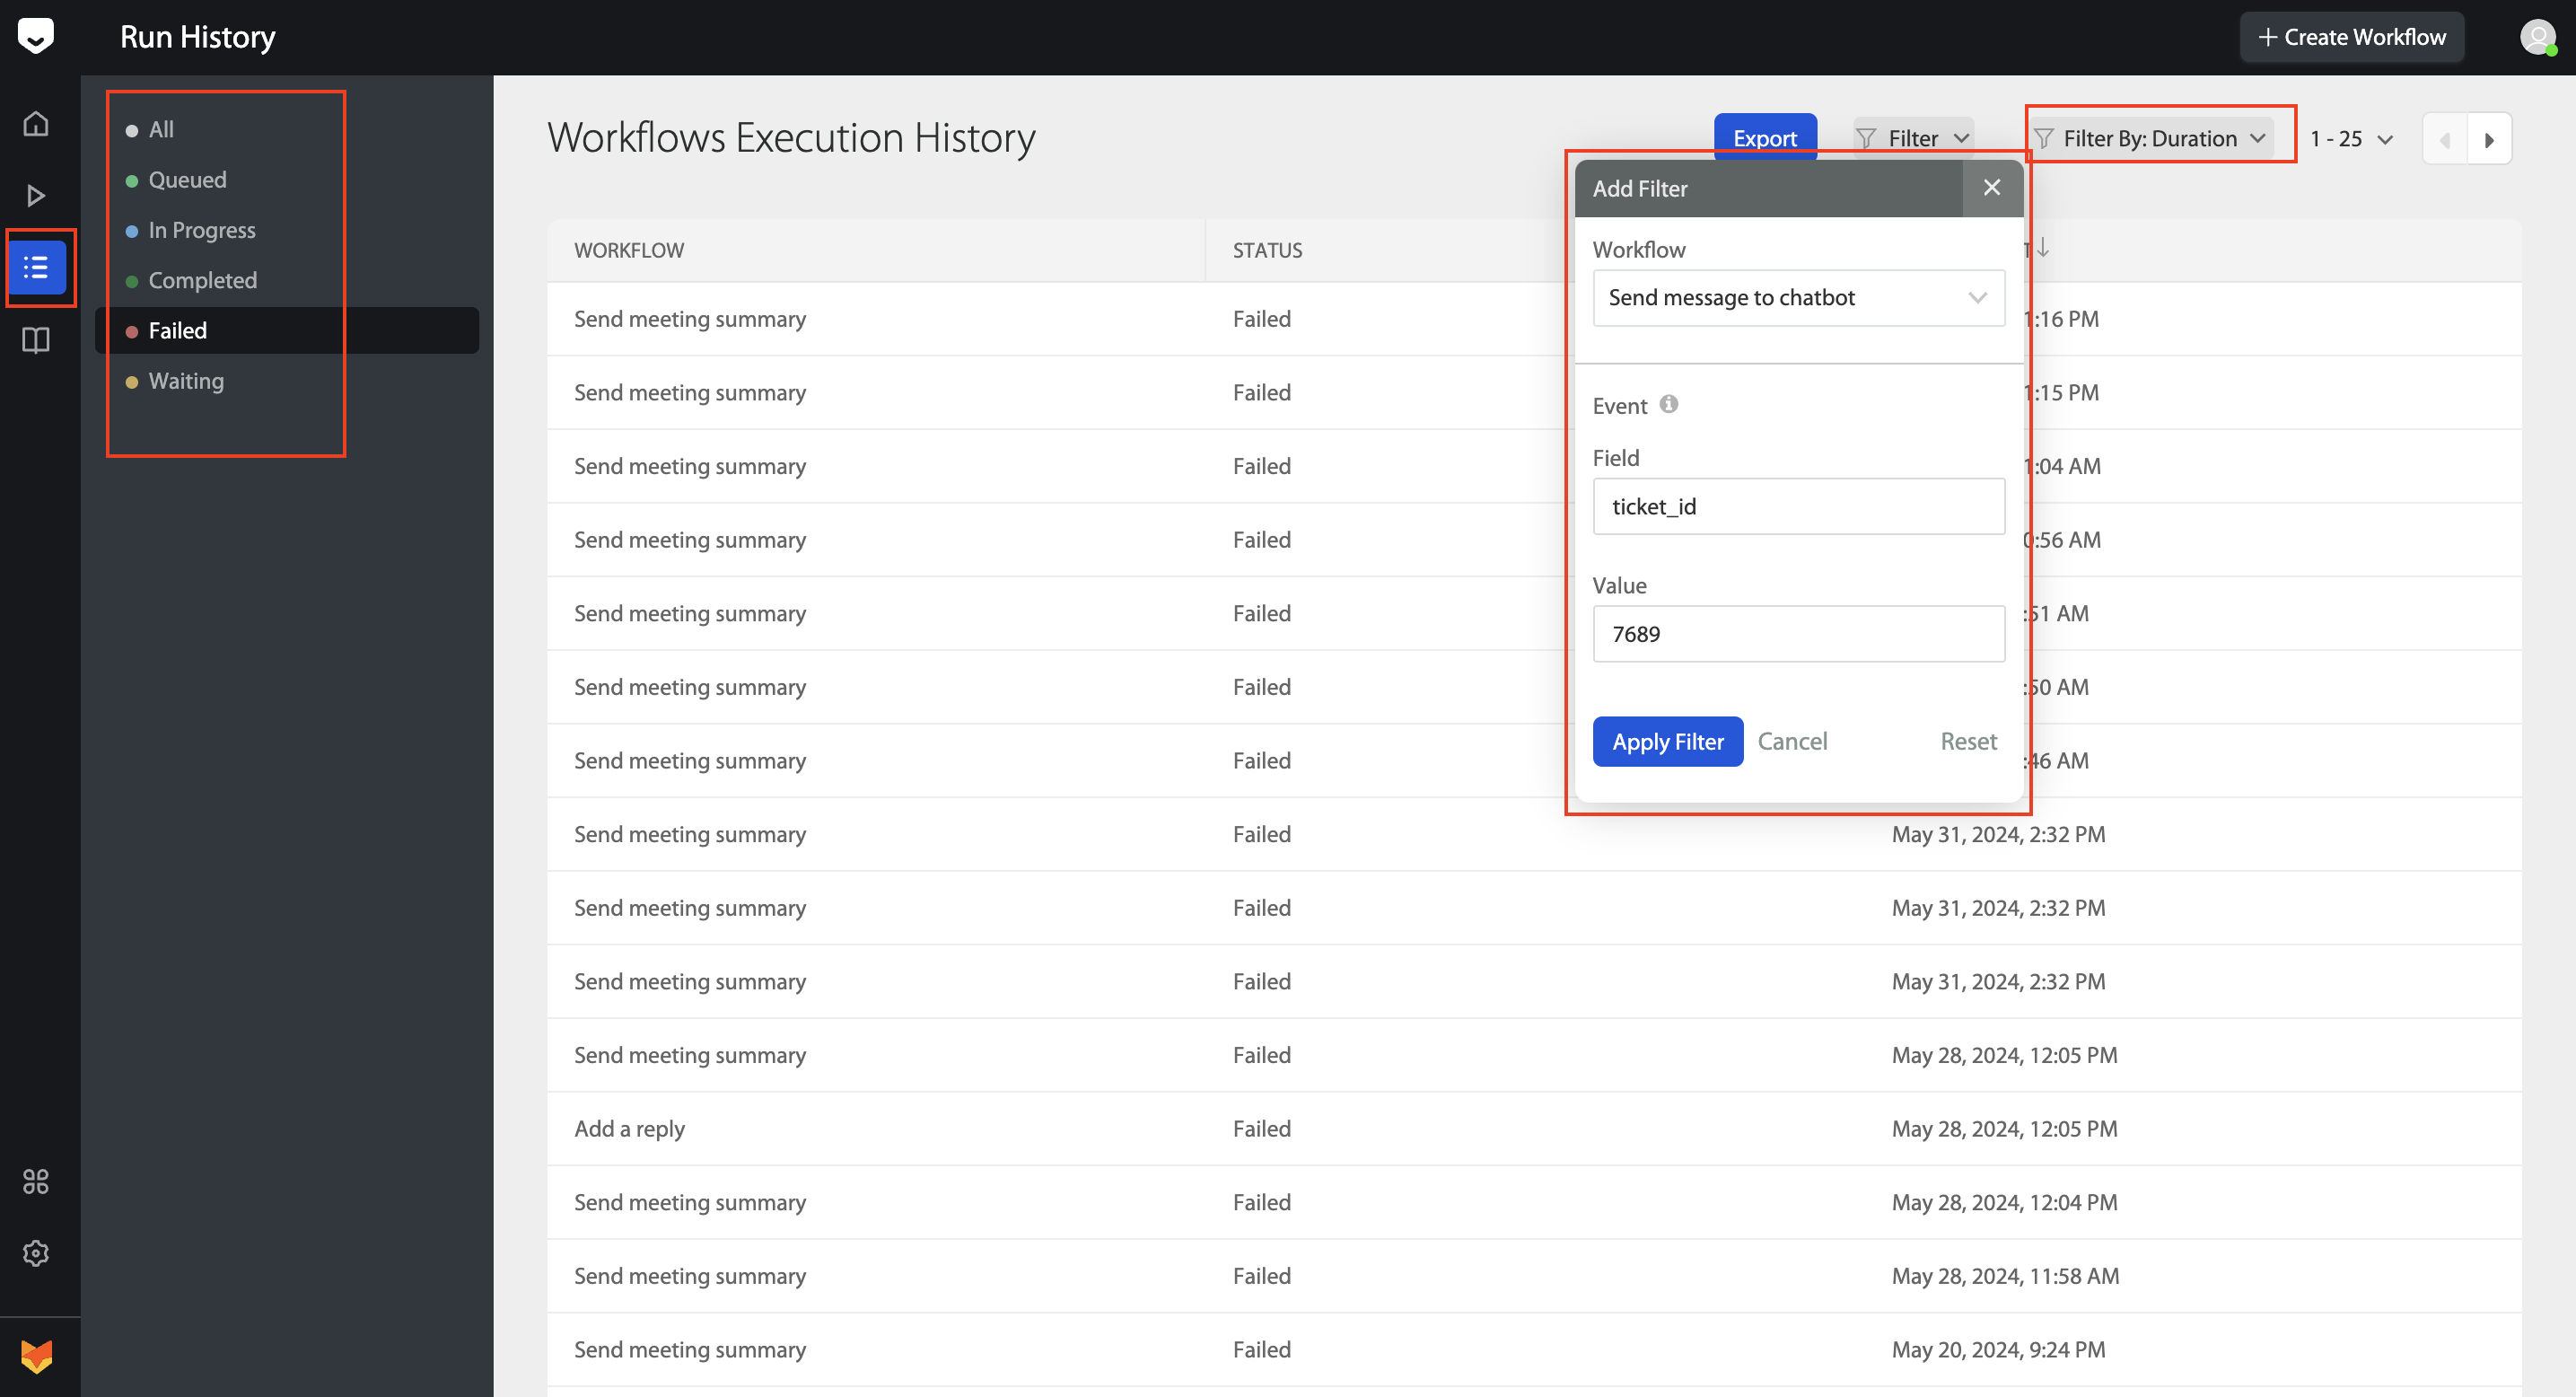
- Optionally, filter the list by workflow name. Select the workflow you want to audit from the Workflow filter and click Save. The list updates to show all executions for that workflow.
- Optionally, filter by ticket. Click Resource Filter, enter a ticket ID, and apply. The list narrows to show only executions triggered by that specific ticket — useful when investigating why a particular ticket did or did not behave as expected.
The Resource Filter panel with a ticket ID entered, showing filtered execution results.
- Click an execution row to open the full execution log.
The execution log detail view showing each workflow step with its status indicator.
Note: The execution log shows every step in the workflow in the order it ran, with a green indicator for steps that succeeded and a red indicator for the step that failed. Steps after the failed step did not run — the workflow stops at the exact point of failure and does not proceed to subsequent actions.
Reading Data In and Data Out
For each step in the execution log, you can inspect the exact data the step received and the result it produced. This confirms whether the workflow processed the correct ticket values.
- Click a step row to expand it.
- Review Data In — the values passed into the step from the trigger ticket or from a previous action's output.
- Review Data Out — the result the step produced after executing.
If Data In shows a blank value for a field you expected to be populated, the issue is upstream: the field was not present on the ticket when the workflow ran, not a misconfiguration in the workflow itself.
Diagnosing a failed step
- Locate the step marked as failed (red indicator).
- Read the error message displayed on that step. The message identifies the exact reason the step could not complete. Common failure reasons:
- Data type mismatch — A step attempted to write a value of the wrong type into a field. For example, passing a text value into a custom field configured to accept only a date. Correct the field type or the value being passed.
- Character limit exceeded — A step attempted to use a value that exceeds the field's character limit. For example, creating a related ticket where the subject line is longer than 200 characters. The error message states: "Subject: ensure this field has no more than 200 characters." Shorten the subject by editing the action or using Transform Text to truncate the value.
- Required field missing — A step requires a specific field to be present but the field was empty at execution time. For example, a Create Contact action requires a valid email address — if the email field on the trigger ticket is blank, the step fails. Check that the required field is reliably populated before the workflow runs.
Note: If you have enabled the notification settings for the workflow, you will receive an email with the error message.
- After resolving the root cause, re-run the workflow on the same ticket.

Reading the trigger payload
Each execution log also includes a Trigger Data panel showing the raw ticket values that were present when the workflow fired. This sits alongside the Data In and Data Out for each step, and is the right place to check when a workflow ran without errors but produced unexpected output — for example, when a message was sent with a blank field where you expected a value.
To view the trigger payload:
- Open the execution detail view.
- Click Trigger Data to expand the panel.
- Locate the field you expected to contain a value and confirm whether it was populated at the time of execution.
If a field appears blank or is missing in the trigger payload, the field was not populated on the ticket before the workflow ran. The fix is upstream — ensure the field is populated before the trigger event fires, not in the workflow configuration itself.