Monitor the real-time distribution of key ticket properties such as status, priority, category, and assignee for tickets created or updated during the specified time period using HappyFox's Distribution Report.
Available on all pricing plans.
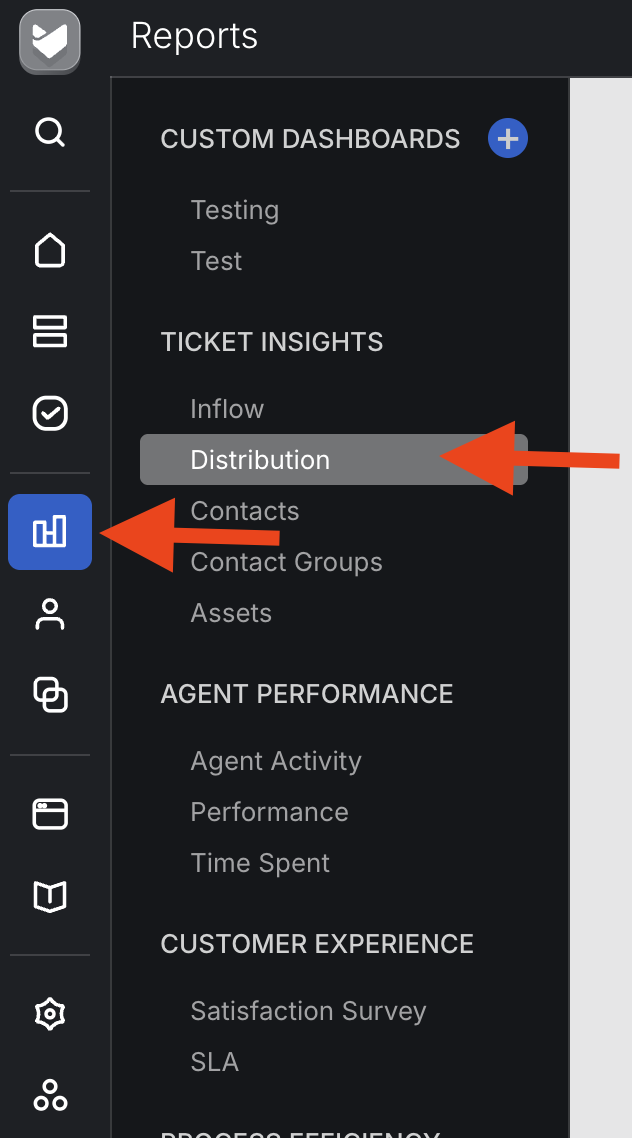
Navigation:
Go to Reports >> Distribution (From the module switcher).
How to set up the Distribution report?
- Choose the desired Categories for which you want the report statistics to be based upon.
- Choose the ticket activity filter for the report:
- Ticket Creation: Filter by the tickets that were created in the selected time period.
- Ticket Update: Filter by the tickets that had any ticketing update in the selected time period.
- Select the time period for the report. The report statistics will populate based on the tickets that had ticket creation/update activity during the selected time period.

Summary Pane:
Overview tabs in the summary pane give you a gist on some overall ticket distribution statistics:
Max tickets in Status: Displays the status with the most number of tickets and the corresponding ticket count.
Max tickets in Category: Displays the category with the most number of tickets and the corresponding ticket count.
Max tickets in Priority: Displays the priority with the most number of tickets and the corresponding ticket count.
Max tickets for an Assignee: Displays the Agent with the most number of tickets assigned and the corresponding ticket count.

Distribution by Assignee:
This widget gives a quick overview of the distribution of assignees across tickets in your help desk. Only the ticket's current assignee is taken into consideration while calculating the metric.
Note: A maximum of 200 assignees will be displayed in the widget. If you want to quickly narrow down to a specific assignee/agent, you can use the "Search" functionality.

Distribution by Category:
This widget visualizes the distribution of tickets in across various categories in your help desk. Only the ticket's current category is taken into consideration while calculating the metric. The list of categories displayed in this visualization is controlled by the distribution report's category filter.

Distribution by Priority:
This widget visualizes the distribution of tickets across various priorities in your help desk. Only the ticket's current priority is taken into consideration while calculating the metric.

Distribution by Status:
This widget visualizes the distribution of tickets across various statuses in your help desk. Only the ticket's current status is taken into consideration while calculating the metric.

Distribution by Popular Tags:
This widget gives a quick overview of the top ten most used tags across tickets in your help desk.

Status/Priority/Category Distribution across Ticket Creation:
Status/Priority/Category distribution across ticket creation lets you visualize the time-based distribution of the corresponding ticket property (Status/Priority/Category) across ticket creation.
This widget always displays the current value of a ticket property (Status/Priority/Category) for tickets created at different points in time. This report lets you quickly identify if there are any pending
Impact of ticket activity filter in Status/Priority/Category Distribution across Ticket Creation:
- Ticket Creation: This visualization distributes ticket creation counts across ticket property values (Status, priority, category) based on ticket creation timestamp. The set of tickets taken into consideration for this report: All tickets created in the <time-frame> selected.
- Ticket Update: This visualization distributes ticket creation counts across ticket property values (Status, priority, category) based on ticket creation timestamp. The set of tickets taken into consideration for this report: All tickets updated in the <time-frame> selected.

Frequently Asked Questions:
1) Do deleted tickets account for distribution report statistics?
A: No. Deleted tickets are not taken into consideration in the distribution report. Similarly, deleted agents, categories, priorities or status are also not reported.
2) Are zero values for metrics displayed in the Distribution Report?
A: No. All entries with values >0 are reported in the distribution report.
3) Are deactivated agents taken into consideration for distribution report statistics?
A: Yes. deactivated agents are taken into consideration in the distribution report.