HappyFox provides you with different views to help you understand your customer Helpdesk data better. Once you login to your help desk system, navigate to the Reports >> All Reports Page.

The reports that you have created are listed here under the “Available Reports” section. Click on the report you wish to see
You can modify the default timeline of the report to specify your own timeline.

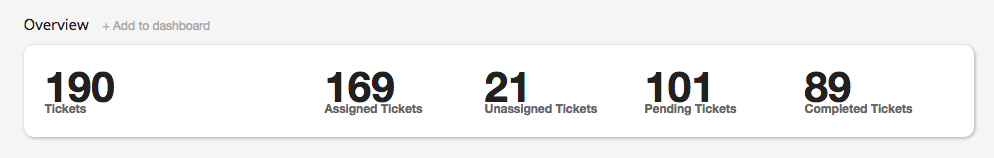
Overview:
The Overview section gives you a summary of the tickets that match the conditions set and the date range selected for this report.
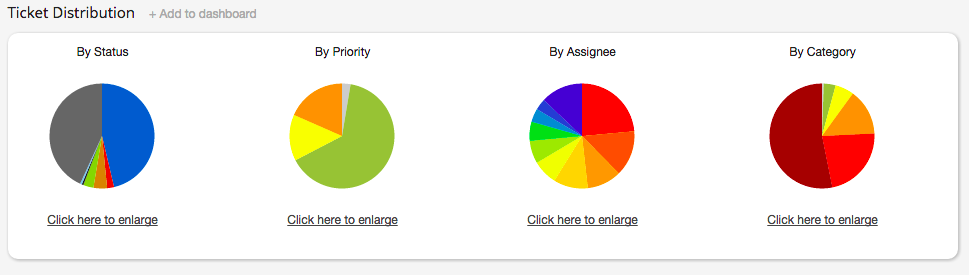
Ticket Distribution
A graphical view of these tickets is present in the Ticket Distribution section. You can filter this graph according to the ticket status, ticket priority, assignee and category.
SLA Performance & Smart Rule Metrics:
These sections display the number of times the SLA/Smart Rule were triggered on the tickets given within the date range. SLA metrics also shows the target and achievement against all of these SLAs.

Tabular View:
This view gives a list of all the tickets, that fall under the conditions specified in the the report, and the date range selected from the top of the report.

While exporting the CSV/Excel from Tabular View, a pop-over lets you choose the fields that you would like to see in the export. See image below-

Note: If "Strip Newlines from Text Values" is checked, HappyFox will strip out newline characters, tabs and extra whitespaces from the text values of your exported report. Choose this option if Excel is unable to import your .CSV/.XLS tabular report export. We'll be remembering this checkbox preference so that you do not have to change every time!
Note:
1. All reports except the Ticket Distribution and Overview have a CSV/Excel export, which can be further used for custom report generation.
2. Fantastic and Enterprise users also get an option to 'Add to dashboard' feature, which pins the chosen section to the 'My Widgets' dashboard. Refer Custom Dashboard for more information on this.
Other Views:
The average values of First Response, Response Time, Number of Replies and No of replies to completed state can be found in 'Response Stats View'. Further drill-down of these values on per staff basis is available in 'Staff Performance' and 'Staff Activity' view.
When you need to find out the customers who reach out to support more often, or the customers with maximum requests in backlog, or the customers on whom, more time is being spent, you can go to 'Customer activity view'
Extensible Reports:
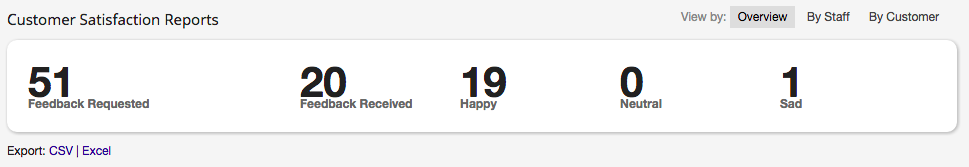
1. Customer Satisfaction Report:
Fantastic and Enterprise users, who make use of HappyFox's Satisfaction Survey Module, can view their CSAT reports here. The data here is represented across three views - Overview, By Staff & By Customer.
This report like all other, has the export option too, which provides the ticket id, update id and staff breakdown of ratings, to facilitate quality analysis.