When reporting an issue to HappyFox Support, you may be asked to share your browser's Console and/or Network logs. These logs often contain the error details needed to identify the root cause of an issue quickly. This article explains how to access these logs in Google Chrome, Mozilla Firefox, and Safari.
Before you start
Open the Network tab before reproducing the issue, or reload the page immediately after opening it, so the log captures activity from the start. If you're unsure which details are safe to share, check with your support representative first.
Google Chrome
Console logs: Open Developer Tools with Cmd+Option+J (Mac) or Ctrl+Shift+J (Windows/Linux), or click the three-dot menu > More tools > Developer Tools, then switch to the Console tab. Errors appear in red, alongside warnings and info messages. Tip: enable "Preserve log" if your issue spans multiple pages.
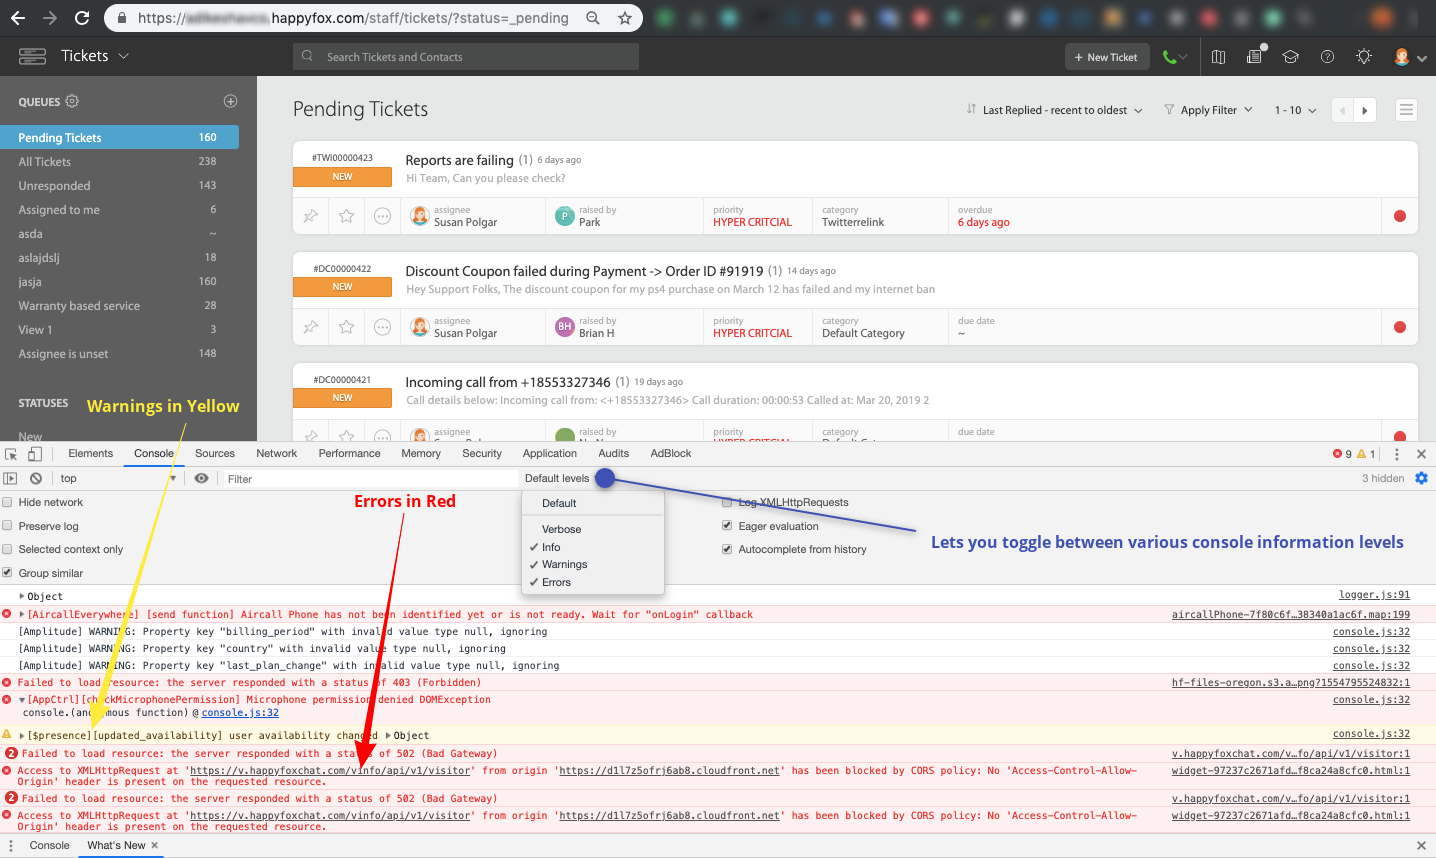
Network logs: Open Developer Tools with Cmd+Option+I (Mac) or Ctrl+Shift+I (Windows/Linux), select the Network tab, and refresh the page. Scroll for entries in red text, then click one to review the Headers, Preview, and Response tabs.


Mozilla Firefox
Console logs: Open the Web Console with Cmd+Option+K (Mac) or Ctrl+Shift+K (Windows/Linux), or select it from the Web Developer submenu in the Firefox menu.
Network logs: Open the Network Monitor with Cmd+Option+E (Mac) or Ctrl+Shift+E (Windows/Linux), or via the Web Developer menu or wrench icon. Scroll for entries in pink text, then click one to review the Headers, Params, and Response tabs.


Safari
Enable the Develop menu (one-time): Safari > Preferences > Advanced, then enable "Show Develop menu in menu bar."
Console logs: Develop > Show JavaScript Console.

Network logs: Open the JavaScript Console, switch to the Network tab, and refresh the page. Errors appear in red text; click one to review the Headers and Preview tabs.

Next steps
Once you've located the relevant entries, take a screenshot or export the log and attach it to your support ticket or email it to [email protected], mentioning your ticket number as a reference. Your representative will confirm exactly which fields are needed.